Vermont’s new climate assessment describes a state swinging between flood and drought
Photo: Farragutful, CC BY-SA 4.0, via Wikimedia Commons.
The University of Vermont released the third Vermont Climate Assessment on Oct. 23, its first statewide update since the last assessment came out in 2021. In that span the state went through two summers of catastrophic flooding and then, in 2025, its worst drought on record. The new report folds those years into the long-term record, and the picture it draws is less about a steady warming trend than about whiplash.
“Vermont is not a climate refuge as once believed,” lead author Gillian Galford, who directs UVM’s Climate Measurements Center of Excellence at the Gund Institute for Environment, told Vermont Public. “Our aging infrastructure, aging population and rural mountainous geography make us more vulnerable to climate impacts.”
The full report runs to several chapters. These are the figures most likely to matter to people who live and work here, drawn from UVM’s summary of the findings and Vermont Public’s reporting.
Temperature and snow
3.6°F. How much Vermont’s average annual temperature has risen since 1900. Southeastern Vermont has warmed the most, by close to 5 degrees on average.
About two feet. The decline in winter snowfall since 1990. Winter is the fastest-warming season, with more midwinter rain, almost four more winter days above 50 degrees and almost 16 fewer days below zero than in 1900.
24 days. How much longer the freeze-free season is than it was in 1900. That sounds like good news for gardeners, but the report notes that late frosts and spring dry spells make the extra time hard to use.
Triple. Burlington now sees three times as many days above 90 degrees as it did in 2020. Statewide, the average year brings three and a half more 90-degree days than it used to, and about a third of Vermont households have air conditioning.
Water, too much and too little
20%. The increase in annual precipitation since 1900. Heavy downpours are more frequent, and the Northeast Kingdom is seeing the fastest growth in extreme rainfall.
$1 billion. The estimated damage from the July 2023 and July 2024 floods combined.
600. The number of private wells that went dry in 2025. Almost half of Vermonters get their drinking water from private wells.
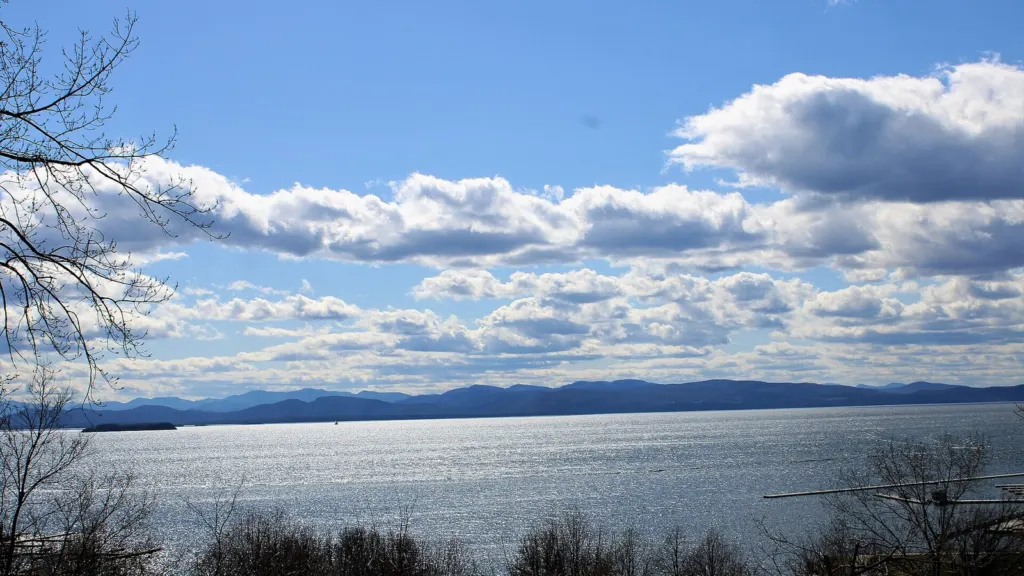
About 7°F. How much warmer the surface of Lake Champlain is, on average, than in the 1960s. Warmer water feeds the cyanobacteria blooms that close Burlington’s beaches.
Farms, tourism and health
$6 million, $16 million, $5 million. Farm losses from the late freeze in 2023, the summer flooding in 2023 and the flooding in 2024. Vermont Public reported that the string of disasters cost farmers about a third of their annual income.
$500 million and $2.2 billion. What foliage season alone brings into the state each year, and what outdoor recreation adds to Vermont’s economy annually. Outdoor recreation accounts for about 5% of the state’s jobs.
Fourfold. The rise in Lyme disease rates since 2008, as more ticks survive milder winters.
“When it’s that hot, it’s really dangerous for our outdoor workers to do their jobs, for kids to have outdoor playtime,” co-author Jessica Balerna said. “Hot days correlate very strongly with emergency department visits in Vermont.”
Not every finding is grim. The 2021 assessment raised doubts about whether skiing would stay viable late in the century. This one expects more boom-and-bust winters but says ski areas should still have the water they need for snowmaking.
The report was built with input from nearly 200 people at state agencies, towns, nonprofits and businesses, and 27 UVM students in the Vermont Climate Corps helped write chapters. Galford, co-editor Balerna and Amanda Sardonis are among its authors. The chapters can be downloaded free from UVM, and the authors discussed their takeaways on Vermont Edition on Oct. 27.